
Big Picture Ideas
In the last meeting, we talked about several topics to explore:
- Is the new currency taking over?
- State vs. Private ownership
Power of Tables & Graphs to Tell Stories
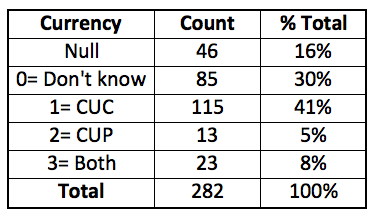
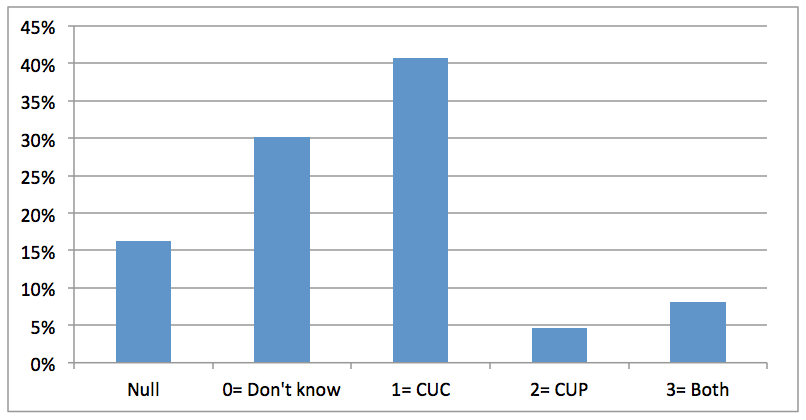
Question 1: Is the new currency taking over?
Answer 1: Yes, the majority of businesses only accept the new currency (40%). Less than 5% only accept the old currency.
Answer 1: Yes, the majority of businesses only accept the new currency (40%). Less than 5% only accept the old currency.
|
|
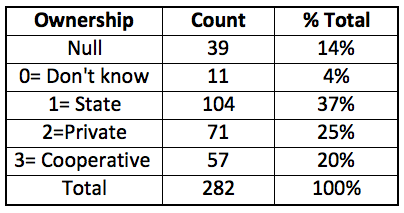
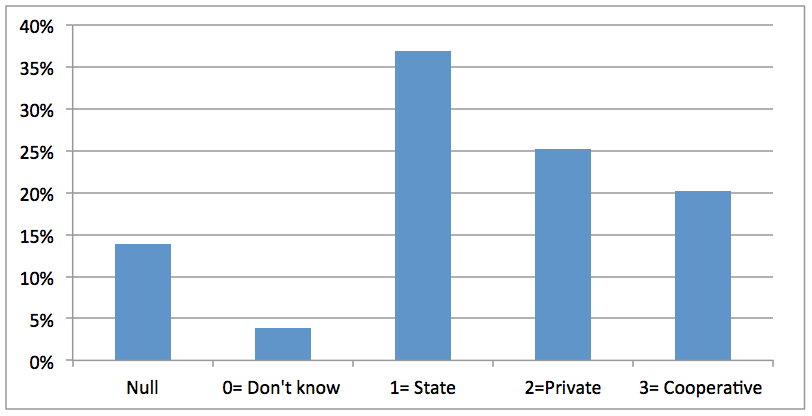
Question 2: Are privately owned businesses becoming more popular in the "new" era?
Answer 2: Most businesses are still state owned (36%); In (20) years, private businesses have increased from 0 to 25%.
Answer 2: Most businesses are still state owned (36%); In (20) years, private businesses have increased from 0 to 25%.
Ownership
|
|
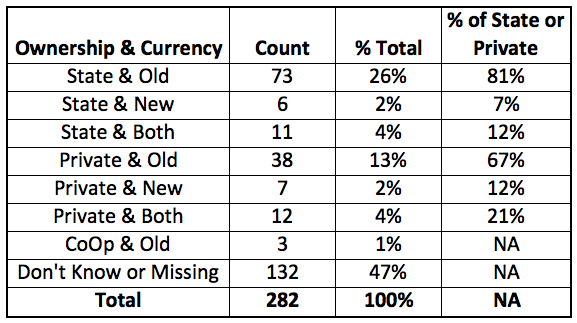
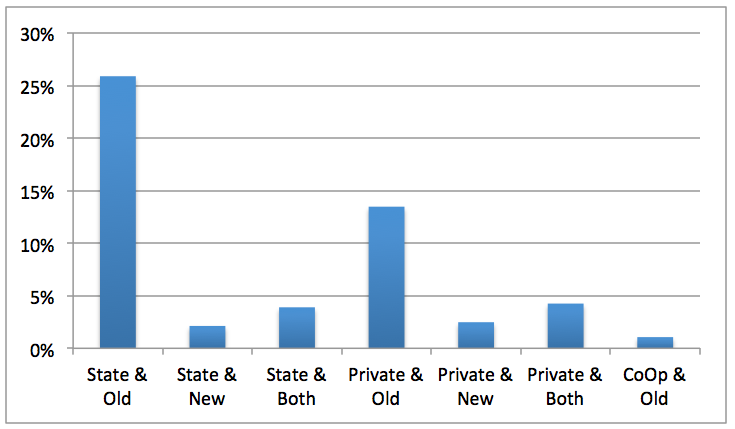
Question 3: Are state owned businesses more likely to accept only the old currency?
Answer 3: Yes, 81% of state owned businesses accept the old currency vs. 67% of private businesses.
Answer 3: Yes, 81% of state owned businesses accept the old currency vs. 67% of private businesses.
|
|
Question 4: There are 3 distinct neighborhoods along the street (west - small buildings; central - medium buildings; east - large buildings). Do different neighborhoods have different trends in ownership or currency? Are most state owned businesses located on the east side?
Question 5: Are there any spatial patterns related to business types (Hadaguanex, Small Enterprises and Tourism)? Are small businesses clustered along the west side near smaller buildings?
Power of Maps to Tell Stories
1. Basic Map showing all data.
2. Basic Map showing spatial pattern of one variable (currency).
3. Complex Map showing spatial pattern of two variables (ownership and currency) side by side.
4. Complex Map showing spatial pattern of two variables (ownership and currency) with a swipe tool.
5. Complex Map with photos and tabs. Now you can see spatial patterns of multiple variables at multiple scales (whole street vs. neighborhoods).
Analysis Results vs. Raw Data
Which variables are independent (x) and which are dependent (y)? Do we exclude missing data from the analysis?
Independent: Ownership, Location (Block)
Dependent: All others?
Presenting raw data vs. presenting conclusion? This website is similar to the graphics/tables/results/discussion section of a paper. Different than presenting all of the raw data. Need to normalize it.
Do we want to 1) present a series of stories with representative subsets of the data answering the research questions (easier for end users) 2) provide all of the data and let users make conclusions on their own (story may not be so obvious to them; more of an analytical approach) 3) or both?
Database Variables vs. Stories to Tell
Type A Stories: Who Cares? What are the broader issues we are exploring (coexistence of capitalism and socialism; stereotypes - maybe we're not so different after all)? What is the significance of this particular location (400 years of history, representative street is a good case study, etc.).
StoryContext: Where/Who Cares?
Visual Exploration
|
Data & VariablesNeed boundaries of 4 plazas (Are these the same as or related to the 3 neighborhoods w/ different "personalities"?)
Major Buildings (Is this from the Excel file: Type = 6, museum or historical site)? |
Template Feature(s)Three frames:
|
Notes1. Is this a good place to:
3. Are there any good intro videos or photos we want to include here? |
Type B Stories: How is the Cuban economic transition manifesting itself on the busiest commercial street in Havana?
StorySpatial Distribution of Private vs. State Business?
|
Database & VariablesExcel - Ownership:0= Don't know 1= State
2=Private
3= Cooperative
Excel - Block (1-10) OR spatial overlay of neighborhood polygons (3)? |
Template Feature(s)Ability to see easily see the entire study area at the same time.
|
NotesAre most state businesses located in a particular neighborhood?
Are they clustered in certain blocks? |
|
Spatial Distribution of Currency - Is the convertible currency taking over?
|
Excel "Currency" field: 0= Don't know 1= CUC 2= CUP 3= Both
|
Ability to see easily see the entire study area at the same time.
|
How many businesses accept the old vs. new currency?
Where are they located? Is there any spatial pattern to which businesses accept each currency (clustering)? |
|
Effects of Private vs. State Business?
Do we want to explore relationships between multiple variables to visualize and quantitatively support our hunches? |
Excel - Ownership and many other variables (see notes)
|
Ability to compare multiple attributes and subsets of data.
|
What differences do we expect to see if a business is state owned vs. privately owned?
|
|
Are we missing any other important stories?
|
What is the importance of these variables?
|
TBD
|
TBD
|
